We use cookies and other tracking technologies to improve your browsing experience on our website, to show you personalized content and targeted ads, to analyze our website traffic, and to understand where our visitors are coming from.
Mathematical Blossoms: Numbers and nature meet, art emerges
“In the dance of equations and curves, mathematics unveils the hidden beauty that art brings to life.”
Mathematics and art have long been intertwined, each discipline enhancing and illuminating the other in ways that transcend simple calculation or aesthetic appeal. This deep, intrinsic connection between mathematics and art is evident in the countless patterns, shapes, and symmetries that both disciplines explore and celebrate. Whether it’s the intricate designs found in Islamic mosaics, the precise proportions of Renaissance architecture, or the abstract forms of modern computational art, mathematics provides a foundation for creating and understanding beauty in the world around us. These patterns are not just limited to human-made art; they are also fundamental to the natural world. The spirals of a sunflower, the symmetry of a snowflake, and the branching of trees all follow mathematical principles, revealing the inherent order and beauty of the universe.
Among the many fascinating figures that arise from the interplay between mathematics and art is the Maurer rose. This captivating geometric shape is a perfect example of how mathematical theory can be used to create something that is not only precise and logical but also visually stunning. The Maurer rose combines the natural elegance of a rose—a symbol of beauty and life—with the rigorous precision of mathematical equations. It is a figure that captures the imagination, illustrating how something as abstract as a mathematical formula can give rise to a form that is rich in aesthetic appeal. The Maurer rose stands as a testament to the harmony between mathematics and art, showing how these two fields, often seen as opposites, can come together to create something truly extraordinary.
Introduction to Maurer Roses
The Maurer rose is a mathematical curve, specifically a type of rose curve, named after the German engineer Peter Maurer who first described it in 1987. The Maurer rose is created by plotting a set of points on a polar coordinate system, connecting them with straight lines rather than the smooth curve typically associated with rose curves. The result is a mesmerizing pattern that can vary from simple, delicate designs to complex and intricate structures, depending on the parameters used.
The Mathematical Foundation
To understand a Maurer rose, we must first understand the rose curve, which is defined by the polar equation:
or
Here, is the radius as a function of the angle , is a scaling factor, and is a positive integer that determines the number of petals in the rose. If is odd, the curve will have petals, and if is even, the curve will have petals.
The Maurer rose is generated by taking this rose curve and connecting points on it with straight lines at certain angular increments. Specifically, the points are selected at angles that are multiples of a fixed angle , usually expressed in degrees. The equation governing the Maurer rose is given by:
In Cartesian coordinates, this can be expressed as:
The curve is drawn by connecting the points with straight lines, where ranges from to a specified upper limit, forming a closed or open figure depending on the values of and .
Exploring Patterns with Different Parameters
The beauty of the Maurer rose lies in the diversity of patterns that can be generated by varying the parameters and . Here’s how different choices of these parameters affect the resulting pattern:
Parameter: This integer determines the basic shape of the rose curve. A small value will produce a simple rose with a few petals, while larger values create more complex structures. For instance, with , the rose has petals, and with , it has petals.
Angle: This angle defines how the points are spaced around the rose. When is a small angle (e.g., or ), the points are closely spaced, creating intricate and dense patterns. When is larger (e.g., or ), the points are more widely spaced, resulting in more open and less complex designs.
For example, consider and . The resulting Maurer rose will have a pattern where lines intersect to create a star-like shape. If is changed to , the figure becomes more intricate, with many lines crossing and weaving to form a much denser pattern.
Visualizing the Maurer Rose
The best way to appreciate the Maurer rose is through visualization. By plotting the points and connecting them as described, one can see how the mathematical parameters influence the shape and complexity of the rose. Modern computational tools and software, such as Python with Matplotlib, R, or even simple graphing calculators, can easily generate these figures, allowing for exploration of countless variations.
Code
import matplotlib.pyplot as pltimport numpy as np# Parameters for the Maurer rosek =7n =360delta_theta =71# Generate the pointstheta = np.arange(0, n*delta_theta, delta_theta) * np.pi /180r = np.sin(k * theta)x = r * np.cos(theta)y = r * np.sin(theta)# Plot the Maurer roseplt.figure(figsize=(6,6))plt.plot(x, y, 'b')plt.title(f"Maurer Rose with k={k} and Δθ={delta_theta}°")plt.axis('equal')plt.show()#_________________________________________________________________________________import sysimport numpy as npimport matplotlib.pyplot as plt"""Plot a "Maurer Rose" with (integer) parameters n, d."""def get_rose_xy(n, d):"""Get the Cartesian coordinates for points on the rose.""" k = d * np.linspace(0, 361, 361) r = np.sin(np.radians(n * k)) x = r * np.cos(np.radians(k)) y = r * np.sin(np.radians(k))return x, ydef draw_rose(ax, n, d, c='r'):"""Draw the Maurer rose defined by (n, d) in colour c.""" x, y = get_rose_xy(n, d) ax.plot(x, y, c=c, lw=0.5) ax.axis('equal') ax.axis('off')if__name__=='__main__':# Set default values for n and diflen(sys.argv) >1: n =int(sys.argv[1])else: n =6# Default valueiflen(sys.argv) >2: d =int(sys.argv[2])else: d =29# Default value fig, ax = plt.subplots() draw_rose(ax, n, d, 'tab:orange') plt.show()
This code will generate a beautiful Maurer rose with and , illustrating the harmonious blend of mathematics and art.
Code
library(ggplot2)library(gganimate)library(gifski)# Set parameters for the Maurer rosek <-4n <-360delta_theta <-97# Generate the pointstheta <-seq(0, n*delta_theta, by=delta_theta) * pi /180r <-sin(k * theta)x <- r *cos(theta)y <- r *sin(theta)# Create a data frame to store the pointsdata <-data.frame(x = x, y = y, frame =seq_along(theta))# Create the plot using ggplot2p <-ggplot(data, aes(x = x, y = y, group =1)) +geom_path(color ="blue") +coord_fixed() +theme_minimal() +ggtitle(paste("Maurer Rose with k =", k, "and Δθ =", delta_theta, "°"))# Animate the plot using gganimateanim <- p +transition_reveal(frame) +ease_aes('linear')# Save the animation as a GIFanim_save("maurer_rose_8.gif", animation = anim, renderer =gifski_renderer(), width =400, height =400, duration =10)
General Algorithm for Generating a Maurer Rose
1. Define the Problem
Objective: Generate a Maurer rose pattern by connecting points on a rose curve.
Inputs:
k: Number of petals in the rose curve.
n: Number of points (or degrees) for calculation.
Δθ (delta_theta): Angular increment between consecutive points.
Output: A visual representation of the Maurer rose, typically as a plotted graph or animation.
2. Set Up the Environment
Choose the Programming Language: Decide whether to use R, Python, or another language.
Import Necessary Libraries: Import libraries like matplotlib for Python or ggplot2 for R, and other relevant packages (e.g., gifski for R or gganimate for R).
3. Define the Mathematical Functions
Rose Curve Formula: Implement the rose curve equation or .
Convert to Cartesian Coordinates: Use the polar to Cartesian conversion:
4. Generate Points on the Curve
Calculate Angular Points:
Create a sequence of angles for
Compute Radii: Calculate the radius for each angle .
Compute Cartesian Coordinates: Use the calculated radii and angles to determine the corresponding and coordinates.
5. Plot the Points
Initialize Plotting Area: Set up the plotting environment with equal aspect ratio to ensure the rose is not distorted.
Plot Points: Connect the points sequentially to create the Maurer rose pattern.
6. Implement Animation (Optional)
Frame Sequence: If animating, create a sequence of frames that reveal the points progressively.
Render Animation: Use an animation library (gganimate in R or FuncAnimation in Python) to render the Maurer rose drawing over time.
7. Test and Validate
Test with Different Parameters: Try different values for k and Δθ to see the variations in the Maurer rose pattern.
Edge Cases: Consider edge cases like k = 1 or very small/large Δθ.
8. Optimize and Refactor
Optimize Performance: Ensure the code runs efficiently, especially if handling large n or complex animations.
Refactor Code: Simplify the code if possible, improving readability and maintainability.
9. Finalize and Save
Finalize Plot: Add titles, labels, and adjust aesthetics.
Save Output: Save the generated plot or animation to a file (e.g., PNG, GIF).
10. Document and Share
Comment the Code: Add comments explaining key parts of the code.
Share the Result: Provide the final output, including the code and the visual representation of the Maurer rose.
Example Outline in Python or R
Python Example:
Import numpy and matplotlib.
Define parameters k, n, and Δθ.
Calculate points and plot using matplotlib.
Optionally, animate using FuncAnimation.
R Example:
Load ggplot2, gganimate, and gifski.
Define the same parameters.
Use ggplot to plot and gganimate for animation.
This algorithm guides you through the entire process, ensuring you cover all aspects of generating and visualizing the Maurer rose.
Code
# maurer rose# turn it in a function of n & dmaurer <-function(n,d){#d angle in degrees #k sequence with 361 anglesk =seq(0,360*d*pi/180,d*pi/180) # d should be in degrees # r r =sin(n*k)#polar form = (sin(nk),k)# x coordinatex = r*cos(k) # this is cartesian coordinate# y coordinatey = r*sin(k)# lets customize it#par function is for parameterspar(bg='black') # black backgroundpar(mar=rep(0,4)) # remove margins#plottingplot(x,y,type='l',col='green') #type l is important}# calling the functionmaurer(2,39) #Change according to your preferences
Applications and Aesthetic Appeal
Maurer roses, like many mathematical curves, have both aesthetic and practical applications. Their intricate designs can be used in graphic design, art, and even architecture, where the interplay of symmetry and complexity adds visual interest. In education, Maurer roses offer a compelling way to introduce students to polar coordinates, trigonometric functions, and the beauty of mathematical patterns. Furthermore, Maurer roses can be found in nature, in the arrangement of petals in flowers, the shapes of shells, and other naturally occurring patterns, demonstrating the universality of mathematical beauty.
Conclusion
The Maurer rose is a perfect example of how mathematics can create stunning visual patterns that appeal to both the mind and the eye. By varying simple parameters, one can explore an infinite range of designs, each with its own unique beauty. Whether for artistic expression or mathematical exploration, the Maurer rose continues to captivate those who delve into its elegant structure. The next time you see a beautifully intricate pattern, whether in nature or art, take a moment to consider the underlying mathematical principles that might be at play—principles that, like the Maurer rose, reveal the deep and timeless connection between mathematics and beauty.
---title: "Mathematical Blossoms: Numbers and nature meet, art emerges"subtitle: "How Simple Equations Create Complex and Captivating Designs"author: "Abhirup Moitra"date: 2024-11-10format: html: code-fold: true code-tools: trueeditor: visualcategories: [Mathematics, R programming]image: math-beauty.jpg---::: {style="color: navy; font-size: 18px; font-family: Garamond; text-align: center; border-radius: 3px; background-image: linear-gradient(#C3E5E5, #F6F7FC);"}**"In the dance of equations and curves, mathematics unveils the hidden beauty that art brings to life."**:::Mathematics and art have long been intertwined, each discipline enhancing and illuminating the other in ways that transcend simple calculation or aesthetic appeal. This deep, intrinsic connection between mathematics and art is evident in the countless patterns, shapes, and symmetries that both disciplines explore and celebrate. Whether it’s the intricate designs found in Islamic mosaics, the precise proportions of Renaissance architecture, or the abstract forms of modern computational art, mathematics provides a foundation for creating and understanding beauty in the world around us. These patterns are not just limited to human-made art; they are also fundamental to the natural world. The spirals of a sunflower, the symmetry of a snowflake, and the branching of trees all follow mathematical principles, revealing the inherent order and beauty of the universe.Among the many fascinating figures that arise from the interplay between mathematics and art is the Maurer rose. This captivating geometric shape is a perfect example of how mathematical theory can be used to create something that is not only precise and logical but also visually stunning. The Maurer rose combines the natural elegance of a rose—a symbol of beauty and life—with the rigorous precision of mathematical equations. It is a figure that captures the imagination, illustrating how something as abstract as a mathematical formula can give rise to a form that is rich in aesthetic appeal. The Maurer rose stands as a testament to the harmony between mathematics and art, showing how these two fields, often seen as opposites, can come together to create something truly extraordinary.# **Introduction to Maurer Roses**The Maurer rose is a mathematical curve, specifically a type of rose curve, named after the German engineer [Peter Maurer](https://pme.uchicago.edu/faculty/peter-maurer) who first described it in 1987. The Maurer rose is created by plotting a set of points on a polar coordinate system, connecting them with straight lines rather than the smooth curve typically associated with rose curves. The result is a mesmerizing pattern that can vary from simple, delicate designs to complex and intricate structures, depending on the parameters used.# **The Mathematical Foundation**To understand a Maurer rose, we must first understand the rose curve, which is defined by the polar equation:$$r(θ)=a⋅\sin(kθ)$$or$$r(\theta) = a . \cos(k\theta)$$Here, $r(\theta)$ is the radius as a function of the angle $\theta$, $a$ is a scaling factor, and $k$ is a positive integer that determines the number of petals in the rose. If $k$ is odd, the curve will have $k$ petals, and if $k$ is even, the curve will have $2k$ petals.The Maurer rose is generated by taking this rose curve and connecting points on it with straight lines at certain angular increments. Specifically, the points are selected at angles that are multiples of a fixed angle $\Delta\theta$, usually expressed in degrees. The equation governing the Maurer rose is given by:$$P_i = (r(\theta_i),\theta_i)\; \text{where}\; \theta_i = i. \Delta \theta$$In Cartesian coordinates, this can be expressed as:$$x_i = r(\theta_i).\cos(\theta_i)$$$$y_i= r(\theta_i). \sin(\theta_i)$$The curve is drawn by connecting the points $P_i$ with straight lines, where $i$ ranges from $0$ to a specified upper limit, forming a closed or open figure depending on the values of $k$ and $\Delta\theta$.## **Exploring Patterns with Different Parameters**The beauty of the Maurer rose lies in the diversity of patterns that can be generated by varying the parameters $k$ and $\Delta\theta$. Here’s how different choices of these parameters affect the resulting pattern:1. **Parameter** $k$: This integer determines the basic shape of the rose curve. A small $k$ value will produce a simple rose with a few petals, while larger $k$ values create more complex structures. For instance, with $k=2$, the rose has $4$ petals, and with $k=5$, it has $5$ petals.2. **Angle** $\Delta\theta$: This angle defines how the points are spaced around the rose. When $\Delta\theta$ is a small angle (e.g., $1°$ or $2°$), the points are closely spaced, creating intricate and dense patterns. When $\Delta\theta$ is larger (e.g., $10°$ or $15°$), the points are more widely spaced, resulting in more open and less complex designs.For example, consider $k=7$ and $\Delta\theta = 36^{0}$. The resulting Maurer rose will have a pattern where lines intersect to create a star-like shape. If $\Delta\theta$ is changed to $5°$, the figure becomes more intricate, with many lines crossing and weaving to form a much denser pattern.# **Visualizing the Maurer Rose**The best way to appreciate the Maurer rose is through visualization. By plotting the points and connecting them as described, one can see how the mathematical parameters influence the shape and complexity of the rose. Modern computational tools and software, such as Python with Matplotlib, R, or even simple graphing calculators, can easily generate these figures, allowing for exploration of countless variations.```{python}#| eval: falseimport matplotlib.pyplot as pltimport numpy as np# Parameters for the Maurer rosek =7n =360delta_theta =71# Generate the pointstheta = np.arange(0, n*delta_theta, delta_theta) * np.pi /180r = np.sin(k * theta)x = r * np.cos(theta)y = r * np.sin(theta)# Plot the Maurer roseplt.figure(figsize=(6,6))plt.plot(x, y, 'b')plt.title(f"Maurer Rose with k={k} and Δθ={delta_theta}°")plt.axis('equal')plt.show()#_________________________________________________________________________________import sysimport numpy as npimport matplotlib.pyplot as plt"""Plot a "Maurer Rose" with (integer) parameters n, d."""def get_rose_xy(n, d):"""Get the Cartesian coordinates for points on the rose.""" k = d * np.linspace(0, 361, 361) r = np.sin(np.radians(n * k)) x = r * np.cos(np.radians(k)) y = r * np.sin(np.radians(k))return x, ydef draw_rose(ax, n, d, c='r'):"""Draw the Maurer rose defined by (n, d) in colour c.""" x, y = get_rose_xy(n, d) ax.plot(x, y, c=c, lw=0.5) ax.axis('equal') ax.axis('off')if__name__=='__main__':# Set default values for n and diflen(sys.argv) >1: n =int(sys.argv[1])else: n =6# Default valueiflen(sys.argv) >2: d =int(sys.argv[2])else: d =29# Default value fig, ax = plt.subplots() draw_rose(ax, n, d, 'tab:orange') plt.show()```::: {layout-ncol="2"}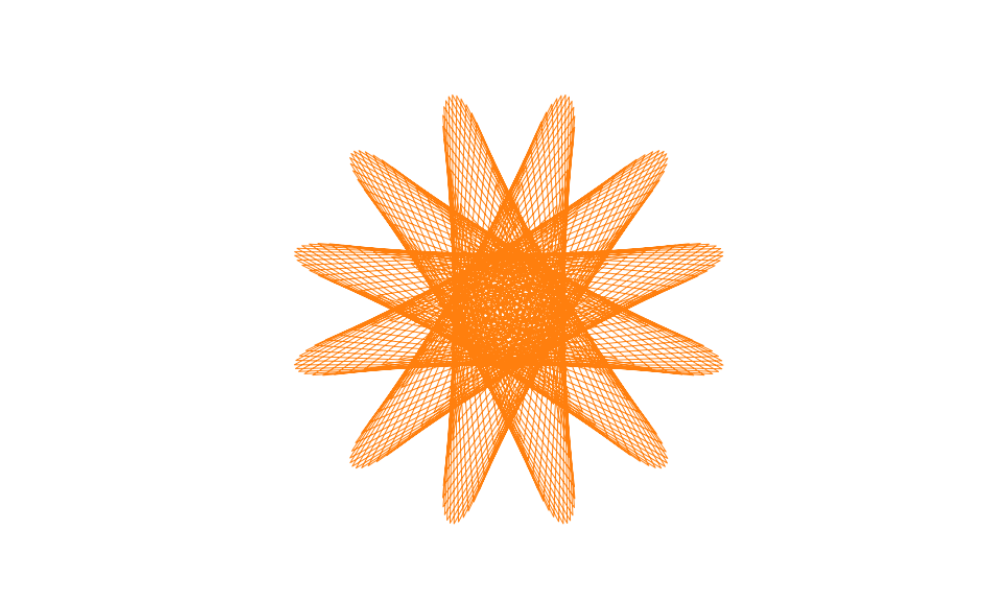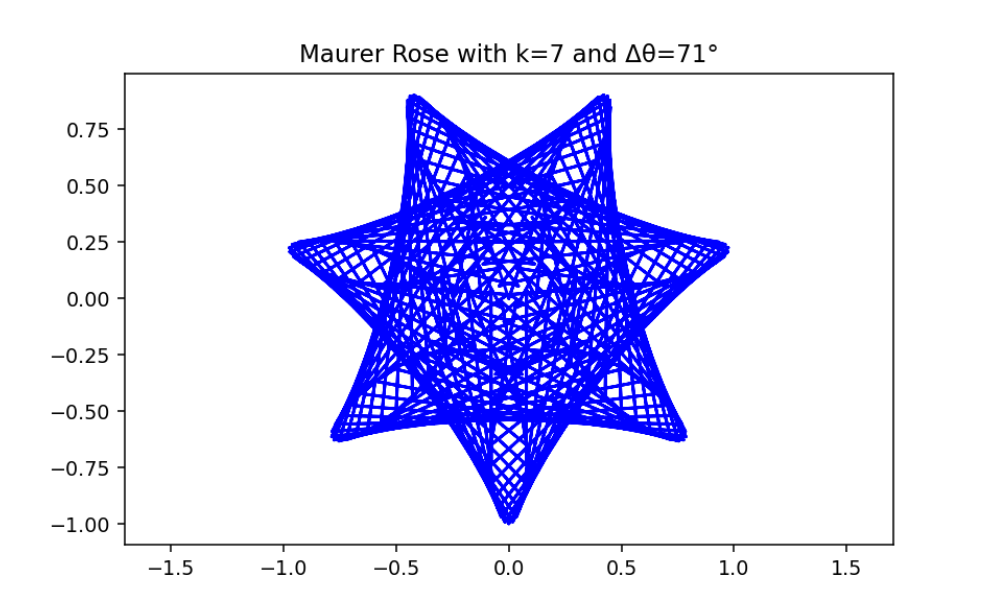:::This code will generate a beautiful Maurer rose with $k=7$ and $\Delta\theta = 71°$, illustrating the harmonious blend of mathematics and art.```{r,eval=FALSE}library(ggplot2)library(gganimate)library(gifski)# Set parameters for the Maurer rosek <- 4n <- 360delta_theta <- 97# Generate the pointstheta <- seq(0, n*delta_theta, by=delta_theta) * pi / 180r <- sin(k * theta)x <- r * cos(theta)y <- r * sin(theta)# Create a data frame to store the pointsdata <- data.frame(x = x, y = y, frame = seq_along(theta))# Create the plot using ggplot2p <- ggplot(data, aes(x = x, y = y, group = 1)) + geom_path(color = "blue") + coord_fixed() + theme_minimal() + ggtitle(paste("Maurer Rose with k =", k, "and Δθ =", delta_theta, "°"))# Animate the plot using gganimateanim <- p + transition_reveal(frame) + ease_aes('linear')# Save the animation as a GIFanim_save("maurer_rose_8.gif", animation = anim, renderer = gifski_renderer(), width = 400, height = 400, duration = 10)```::: {layout-nrow="3"}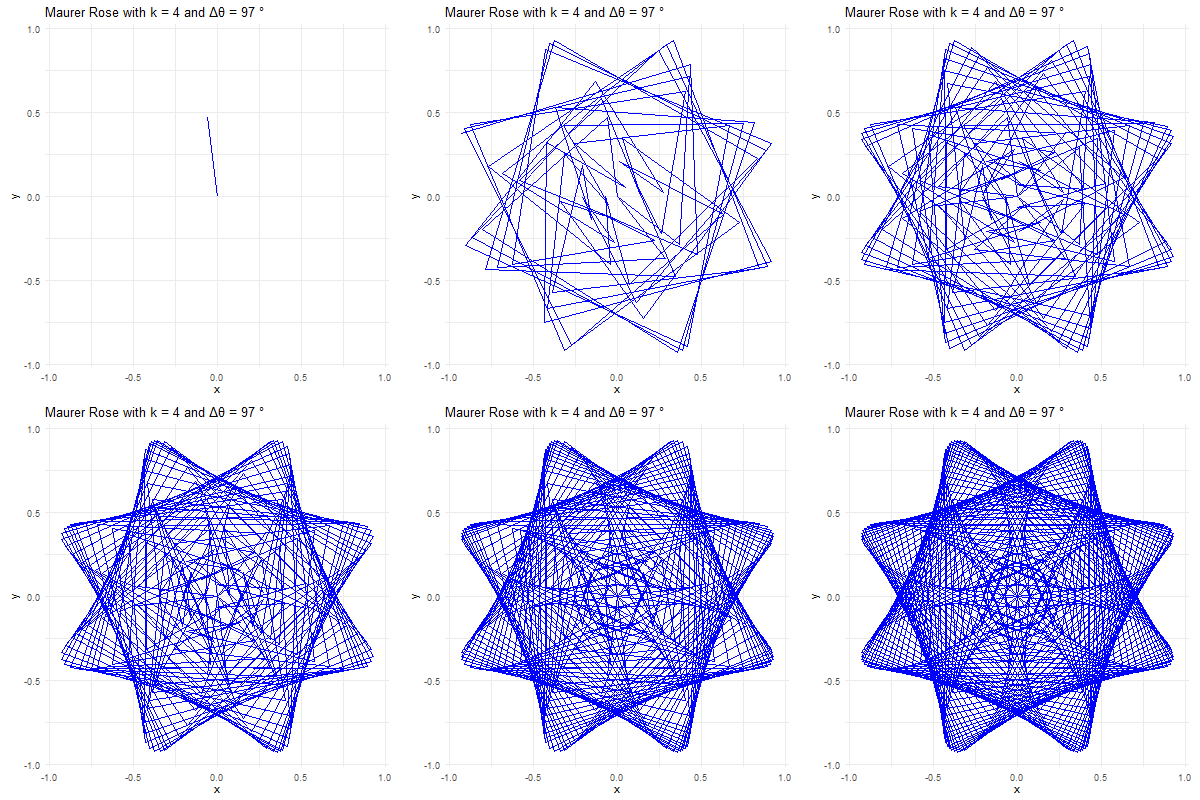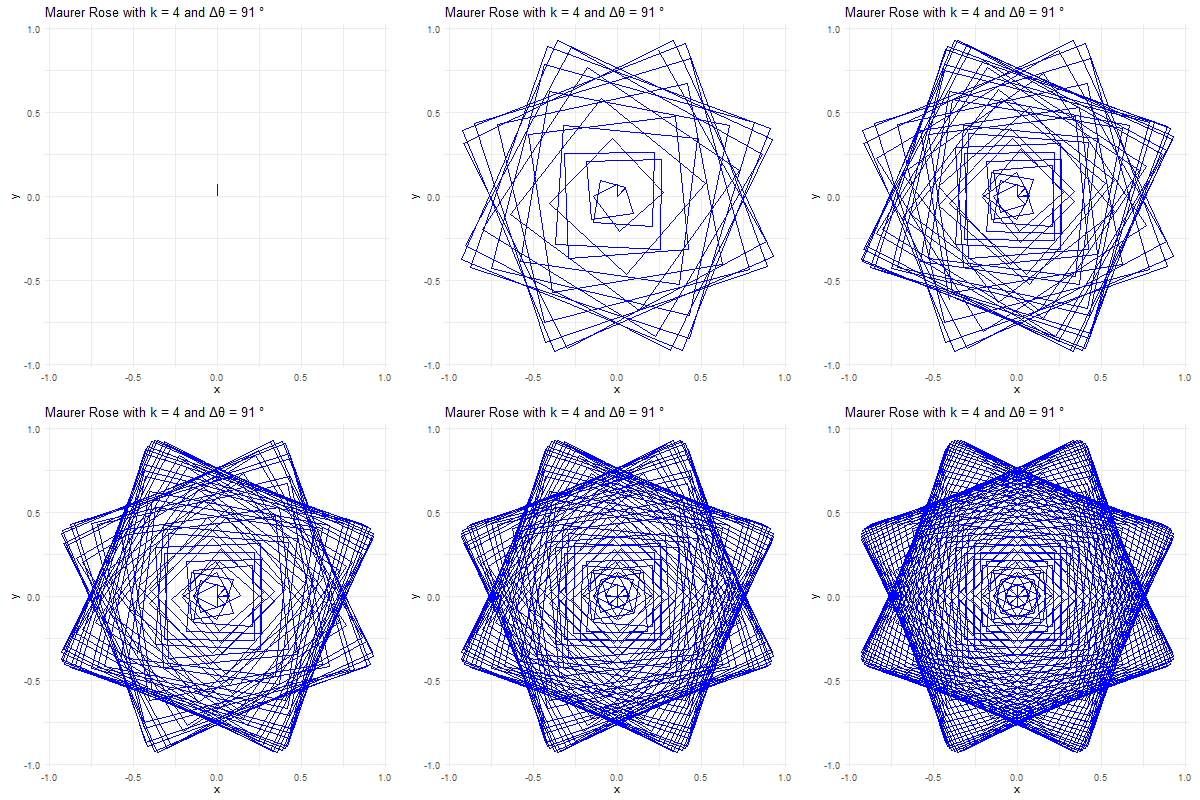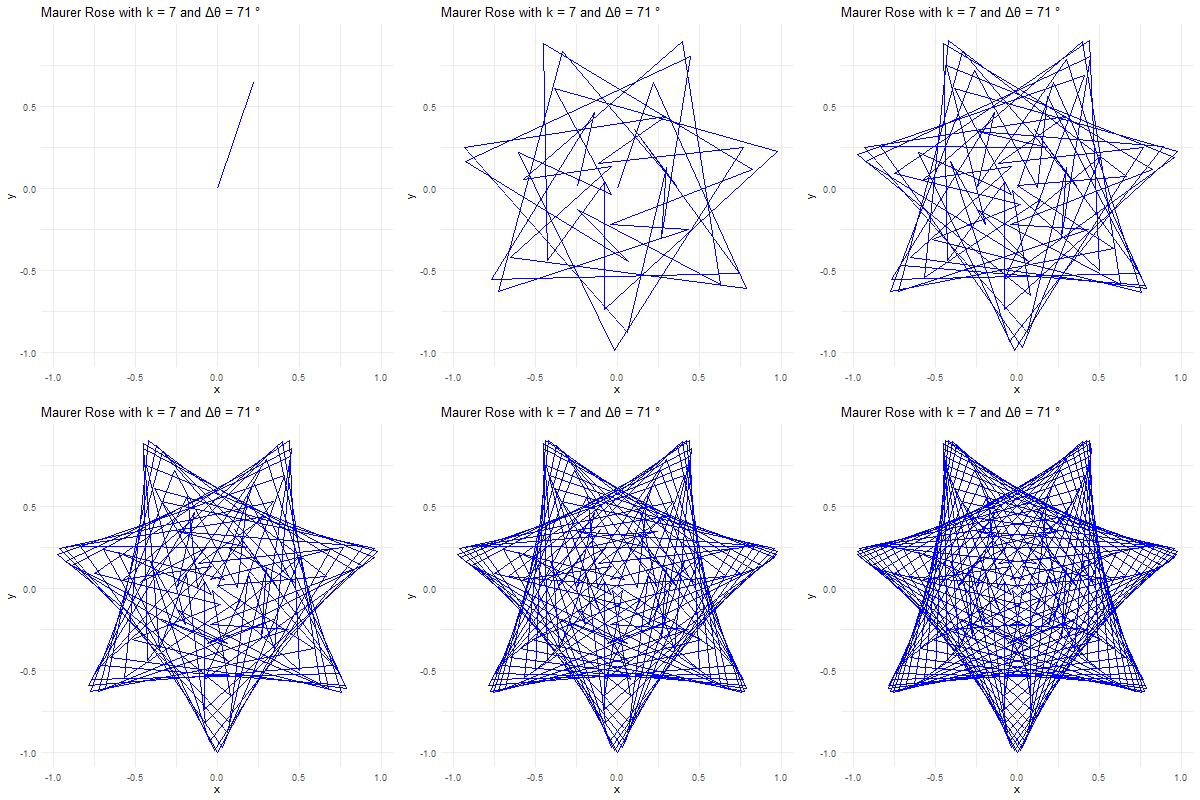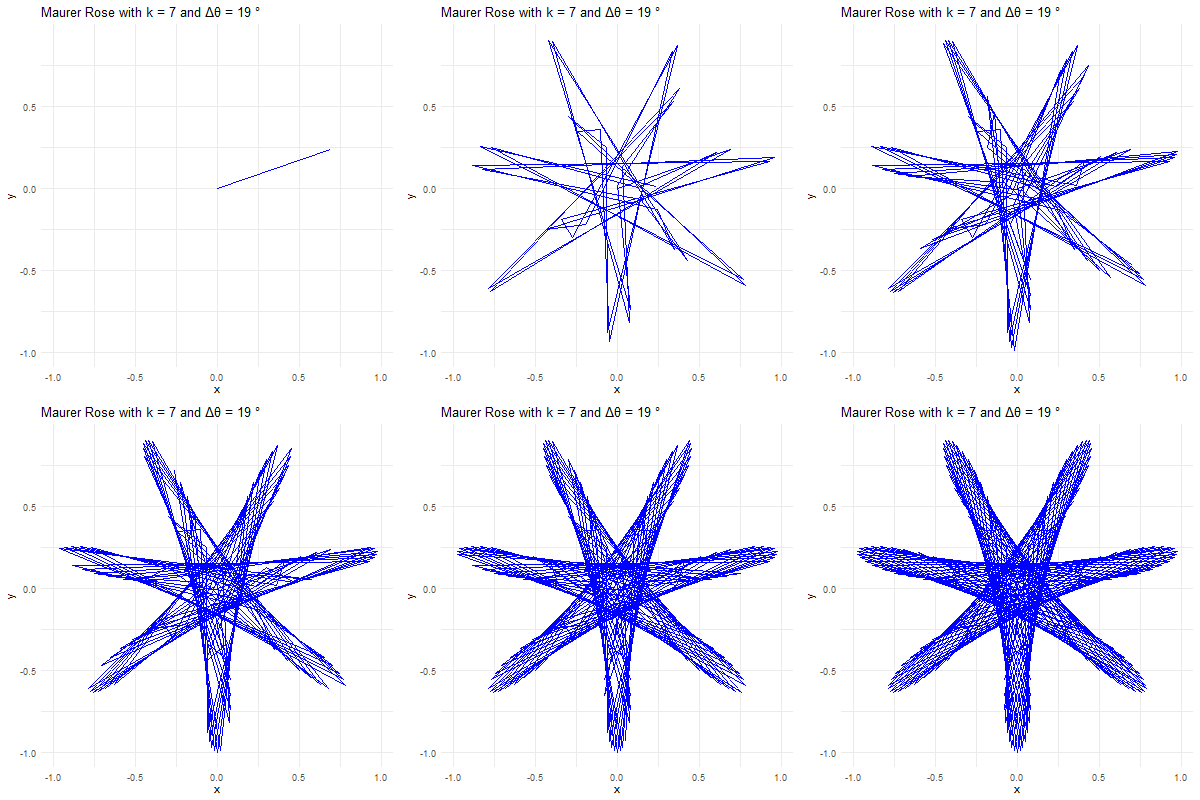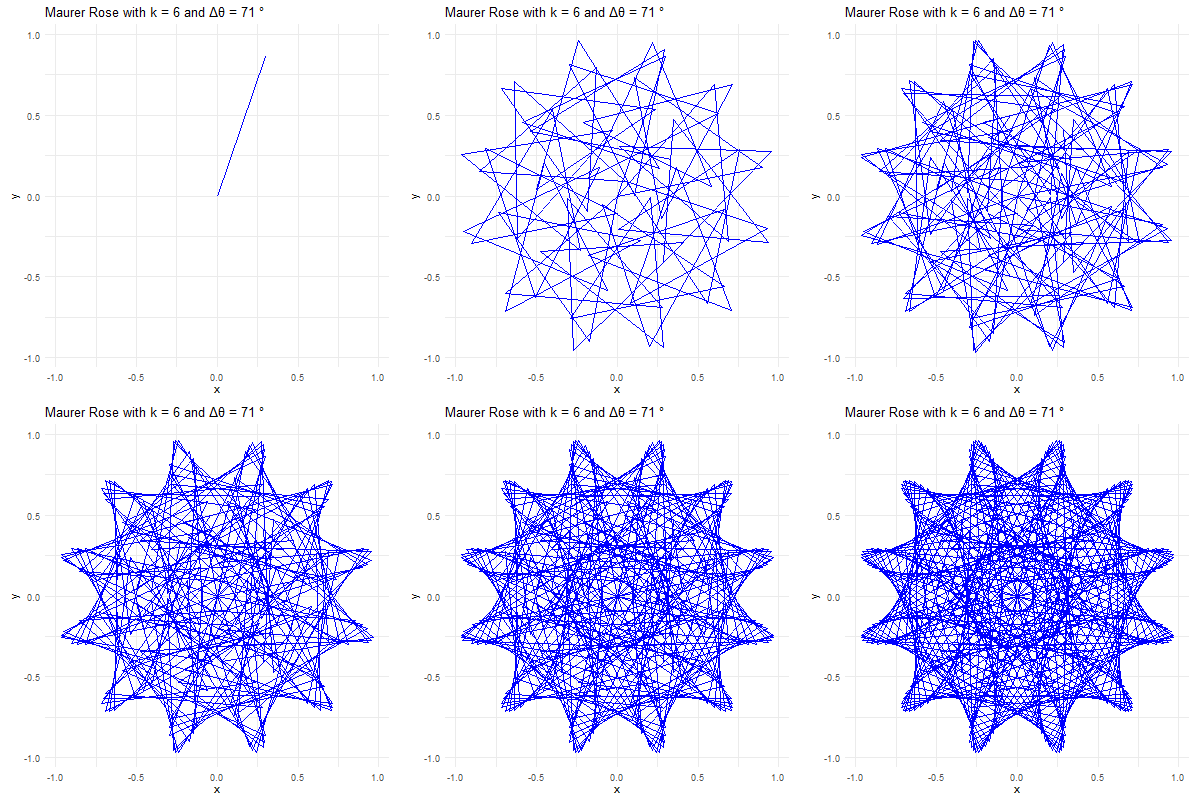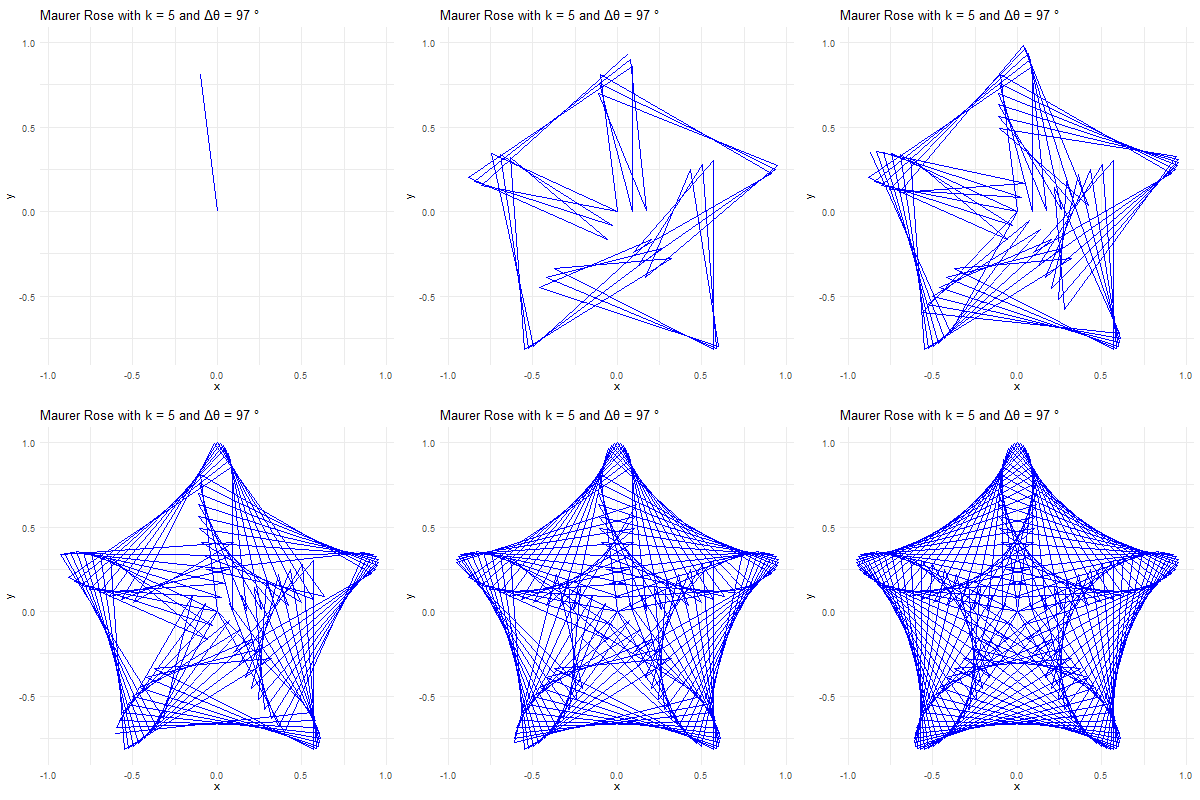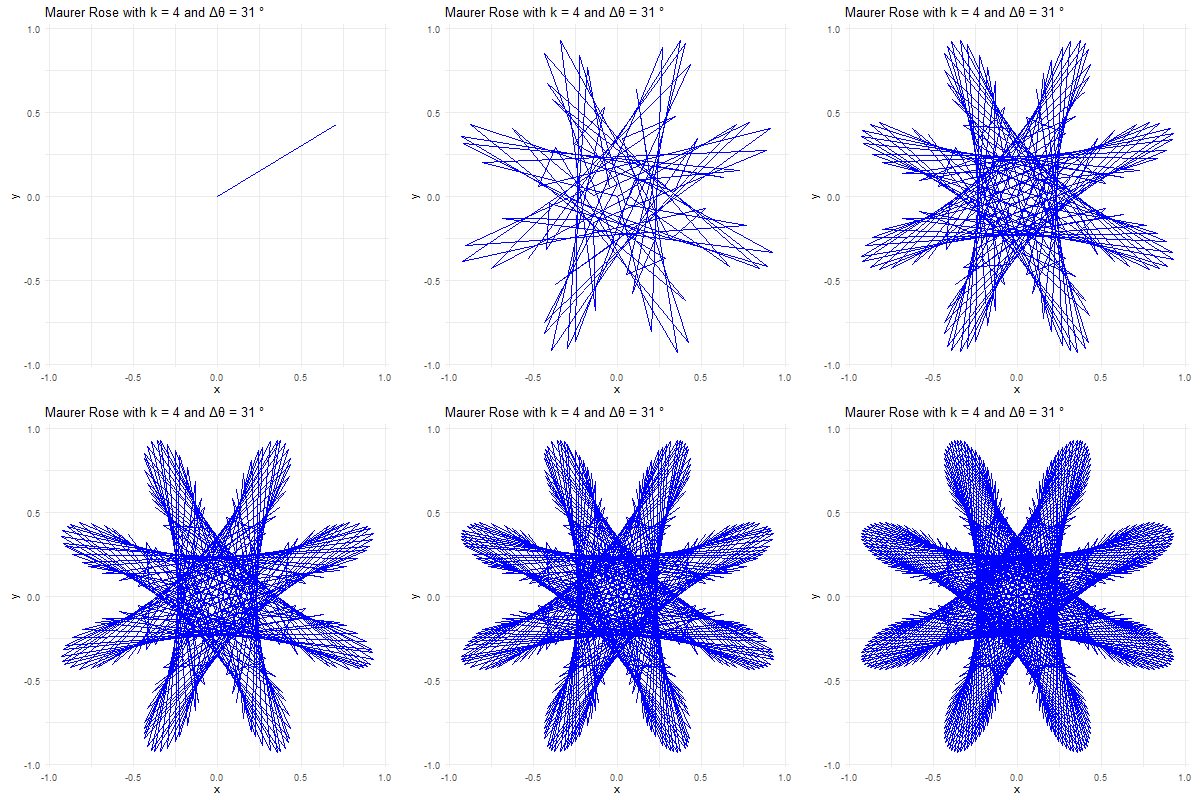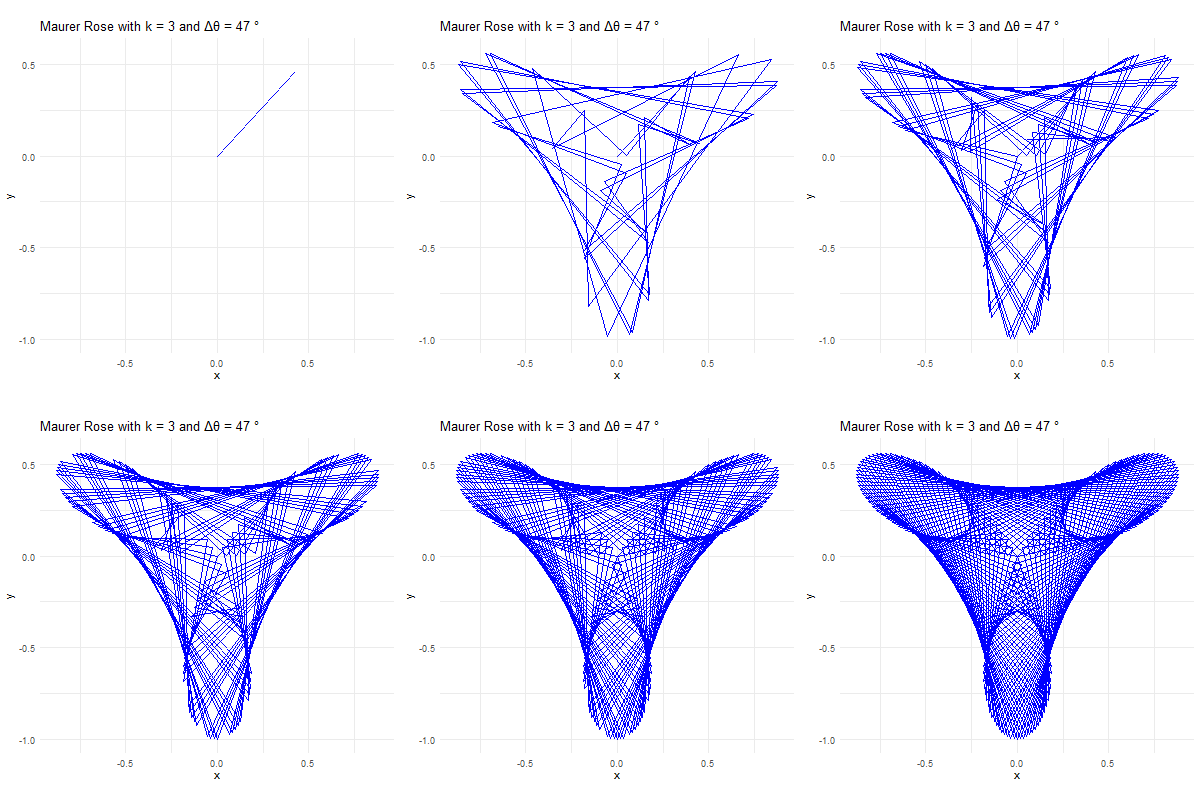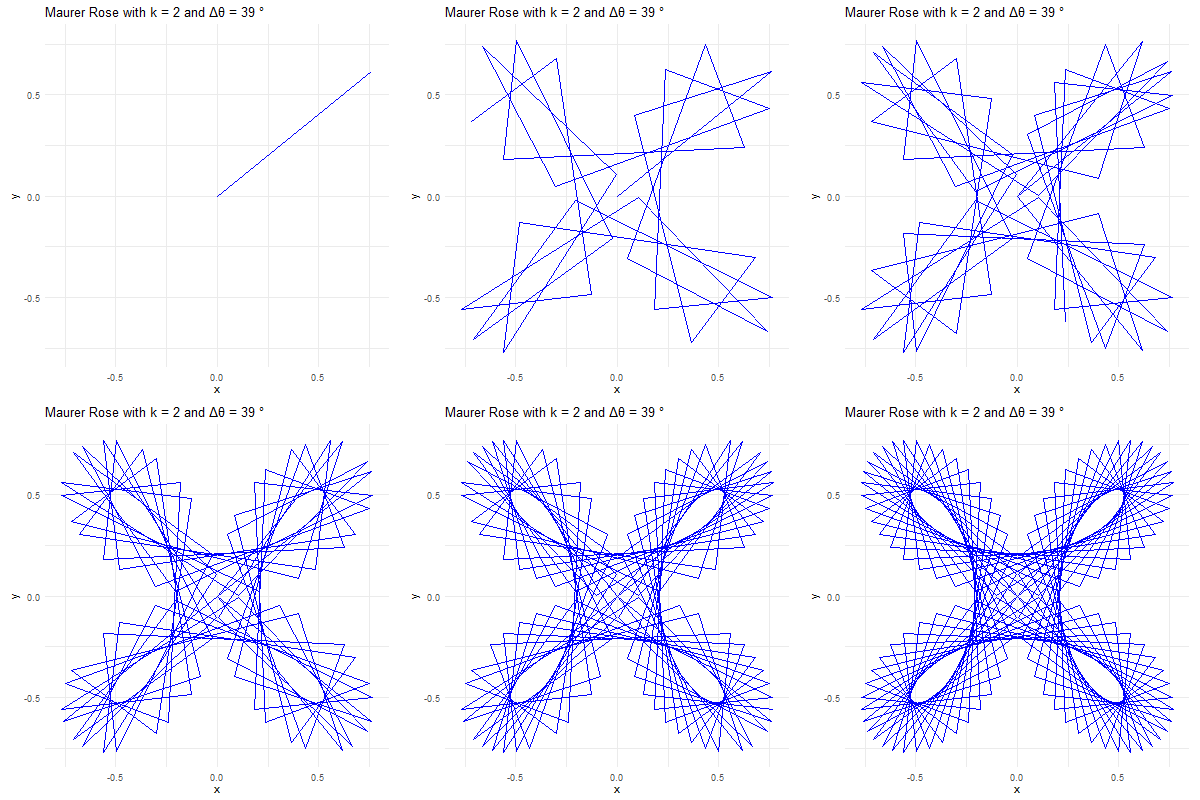:::## General Algorithm for Generating a Maurer Rose1\. **Define the Problem**- **Objective:** Generate a Maurer rose pattern by connecting points on a rose curve.- **Inputs:** - `k`: Number of petals in the rose curve. - `n`: Number of points (or degrees) for calculation. - `Δθ (delta_theta)`: Angular increment between consecutive points.- **Output:** A visual representation of the Maurer rose, typically as a plotted graph or animation.2\. **Set Up the Environment**- **Choose the Programming Language:** Decide whether to use R, Python, or another language.- **Import Necessary Libraries:** Import libraries like `matplotlib` for Python or `ggplot2` for R, and other relevant packages (e.g., `gifski` for R or `gganimate` for R).3\. **Define the Mathematical Functions**- **Rose Curve Formula:** Implement the rose curve equation $r(\theta) = \sin(k\theta)$ or $r(\theta) = \cos(k\theta)$.- **Convert to Cartesian Coordinates:** Use the polar to Cartesian conversion: - $x = r \cdot \cos(\theta)$ - $y = r \cdot \sin(\theta)$4\. **Generate Points on the Curve**- **Calculate Angular Points:** - Create a sequence of angles $\theta_i = i \cdot \Delta\theta$ for $i = 0,1,2,\ldots,n-1$- **Compute Radii:** Calculate the radius $r_i = \sin(k \cdot \theta_i)$ for each angle $\theta_i$.- **Compute Cartesian Coordinates:** Use the calculated radii and angles to determine the corresponding $x_i$ and $y_i$ coordinates.5\. **Plot the Points**- **Initialize Plotting Area:** Set up the plotting environment with equal aspect ratio to ensure the rose is not distorted.- **Plot Points:** Connect the points $(x_i, y_i)$ sequentially to create the Maurer rose pattern.6\. **Implement Animation (Optional)**- **Frame Sequence:** If animating, create a sequence of frames that reveal the points progressively.- **Render Animation:** Use an animation library (`gganimate` in R or `FuncAnimation` in Python) to render the Maurer rose drawing over time.7\. **Test and Validate**- **Test with Different Parameters:** Try different values for `k` and `Δθ` to see the variations in the Maurer rose pattern.- **Edge Cases:** Consider edge cases like `k = 1` or very small/large `Δθ`.8\. **Optimize and Refactor**- **Optimize Performance:** Ensure the code runs efficiently, especially if handling large `n` or complex animations.- **Refactor Code:** Simplify the code if possible, improving readability and maintainability.9\. **Finalize and Save**- **Finalize Plot:** Add titles, labels, and adjust aesthetics.- **Save Output:** Save the generated plot or animation to a file (e.g., PNG, GIF).10\. **Document and Share**- **Comment the Code:** Add comments explaining key parts of the code.- **Share the Result:** Provide the final output, including the code and the visual representation of the Maurer rose.## Example Outline in Python or R- **Python Example:** - Import `numpy` and `matplotlib`. - Define parameters `k`, `n`, and `Δθ`. - Calculate points and plot using `matplotlib`. - Optionally, animate using `FuncAnimation`.- **R Example:** - Load `ggplot2`, `gganimate`, and `gifski`. - Define the same parameters. - Use `ggplot` to plot and `gganimate` for animation.This algorithm guides you through the entire process, ensuring you cover all aspects of generating and visualizing the Maurer rose.```{r,eval=FALSE}# maurer rose# turn it in a function of n & dmaurer <- function(n,d){#d angle in degrees #k sequence with 361 anglesk = seq(0,360*d*pi/180,d*pi/180) # d should be in degrees # r r = sin(n*k)#polar form = (sin(nk),k)# x coordinatex = r*cos(k) # this is cartesian coordinate# y coordinatey = r*sin(k)# lets customize it#par function is for parameterspar(bg='black') # black backgroundpar(mar=rep(0,4)) # remove margins#plottingplot(x,y,type='l',col='green') #type l is important}# calling the functionmaurer(2,39) #Change according to your preferences```::: {layout-nrow="2"}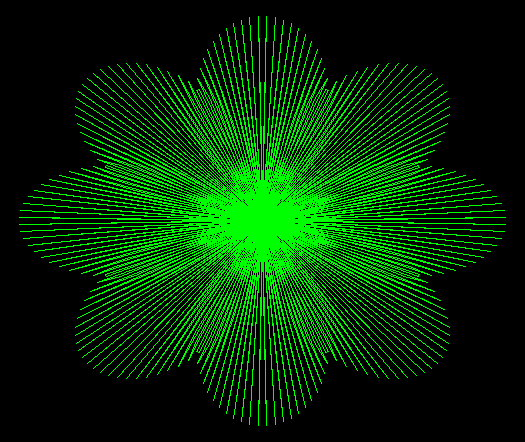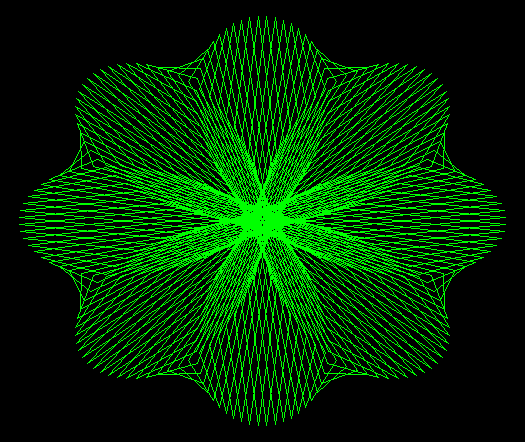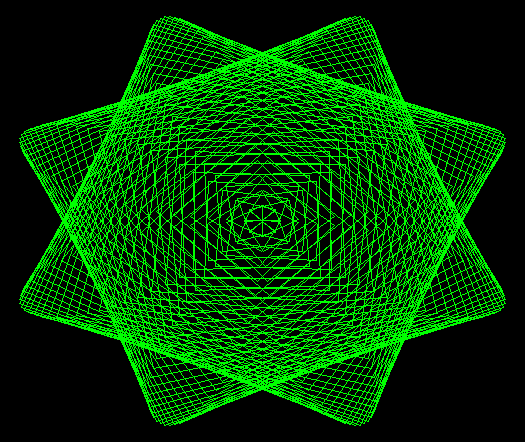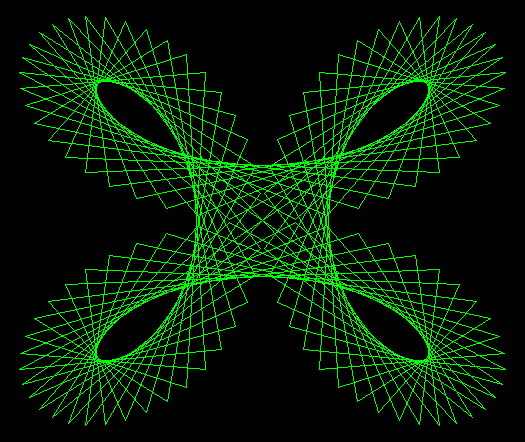:::# **Applications and Aesthetic Appeal**Maurer roses, like many mathematical curves, have both aesthetic and practical applications. Their intricate designs can be used in graphic design, art, and even architecture, where the interplay of symmetry and complexity adds visual interest. In education, Maurer roses offer a compelling way to introduce students to polar coordinates, trigonometric functions, and the beauty of mathematical patterns. Furthermore, Maurer roses can be found in nature, *in the arrangement of petals in flowers*, *the shapes of shells*, and *other naturally occurring patterns*, demonstrating the universality of mathematical beauty.{{< video https://www.youtube.com/watch?v=1yV1fu6F69s&t=3s >}}# ConclusionThe Maurer rose is a perfect example of how mathematics can create stunning visual patterns that appeal to both the mind and the eye. By varying simple parameters, one can explore an infinite range of designs, each with its own unique beauty. Whether for artistic expression or mathematical exploration, the Maurer rose continues to captivate those who delve into its elegant structure. The next time you see a beautifully intricate pattern, whether in nature or art, take a moment to consider the underlying mathematical principles that might be at play—principles that, like the Maurer rose, reveal the deep and timeless connection between mathematics and beauty.# **References**- Maurer, Peter M. (August–September 1987). "A Rose is a Rose...". *The American Mathematical Monthly*. **94** (7): 631–645. [CiteSeerX](https://en.wikipedia.org/wiki/CiteSeerX_(identifier) "CiteSeerX (identifier)") [10.1.1.97.8141](https://citeseerx.ist.psu.edu/viewdoc/summary?doi=10.1.1.97.8141). [doi](https://en.wikipedia.org/wiki/Doi_(identifier) "Doi (identifier)"):[10.2307/2322215](https://doi.org/10.2307%2F2322215). [JSTOR](https://en.wikipedia.org/wiki/JSTOR_(identifier) "JSTOR (identifier)") [2322215](https://www.jstor.org/stable/2322215).- [Weisstein, Eric W.](https://en.wikipedia.org/wiki/Eric_W._Weisstein "Eric W. Weisstein") "Maurer roses". MathWorld. (Interactive Demonstrations)# **Further Readings**- [**Symmetry in Motion: Exploring Artistic Patterns Through Mathematical Curves**](https://abhirup-moitra-mathstat.netlify.app/strategies-and-rprogram/mystery-curves/)- [**Rose Curve**](https://mathworld.wolfram.com/RoseCurve.html){fig-align="center" width="423"}