Code
library(R6)
library(ggplot2)
library(uuid)
options(stringsAsFactors = FALSE)Algorithmic Elegance
“In the intricate dance of chaos, fractals emerge as the poetry of geometry, revealing the beauty of infinity in finite form.”
In this article, we’re going to explore OOP in R as implemented by the R6 package. In the end, the goal is to create an animated fractal tree with R6& gganimate. Here, we will be creating a static plot of a fractal tree and a series of R6Class objects to help get us there.
We’re interested in exploring R6 functionality; it’s not claiming to be the best way to create our fractal trees. Some design choices were solely to leverage varied features. Additionally, this post is more example-based than explanation-based. For more in-depth explanations, It is recommended to go to this page from R6 or check out this chapter from Advanced R
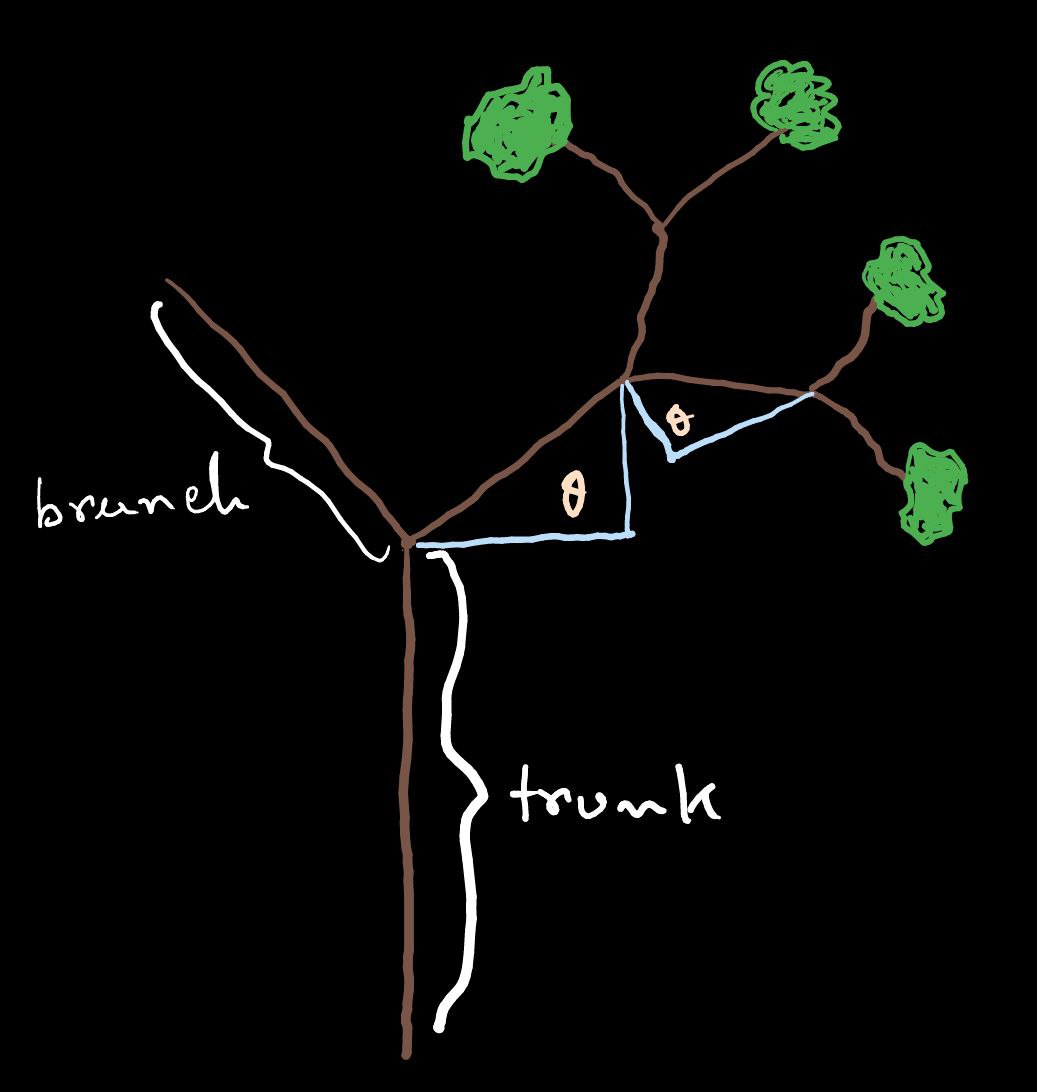
The sketch above shows the basic design of the fractal tree we’ll be creating as an R6 object; let’s unpack it. We’ll have a vertical line as the trunk and a series of branch lines that recursively sprout two at a time. Lastly, each child branch will have the same angle relative to its parent branch. Let’s translate the sketch into the object structure that we’ll be using.
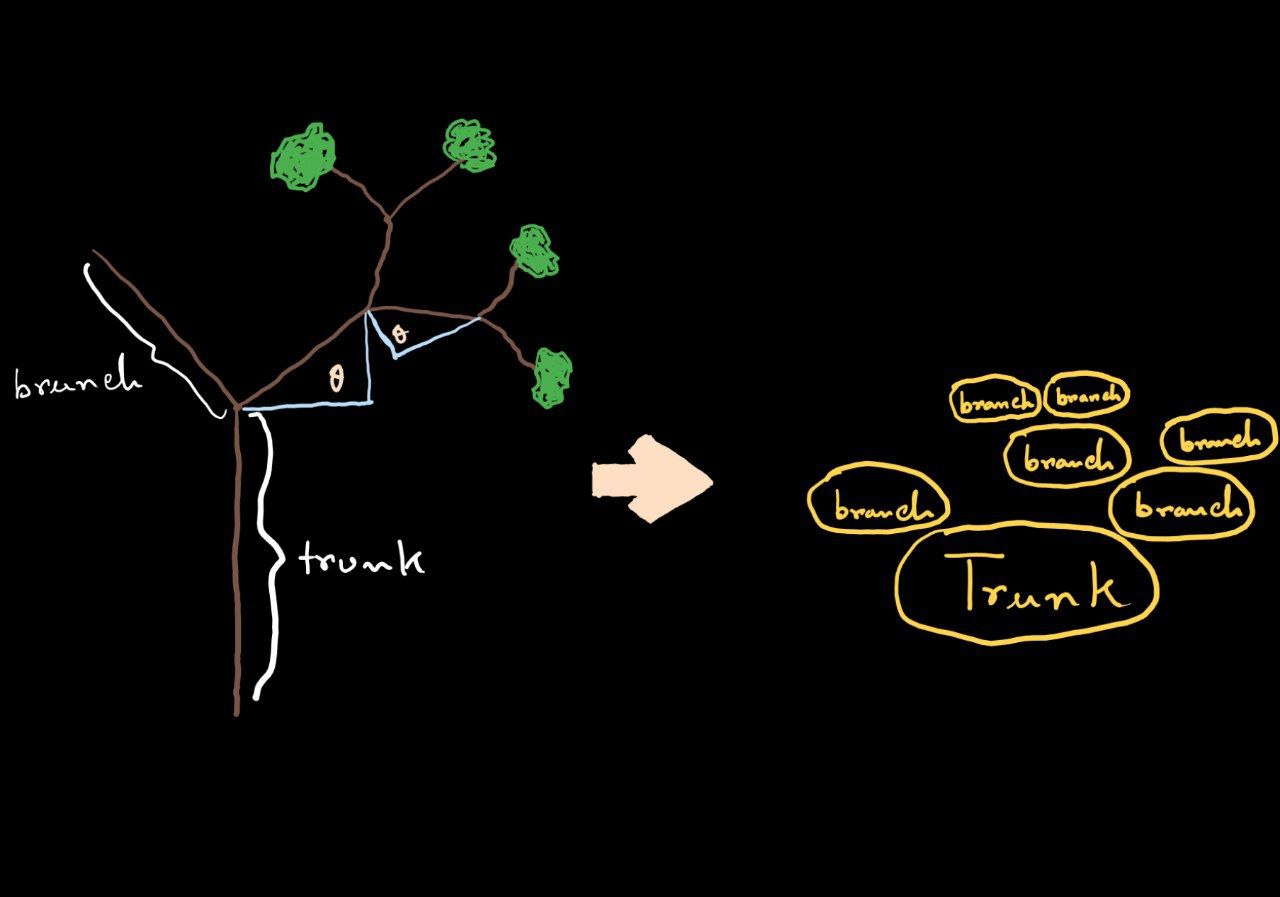
The way it’s drawn up, we see that we’ll be using two separate classes for the trunk and branches. The trunk and branches have a lot in common, so we’ll be using the OOP concept of inheritance as implemented by R6.
We’ll be starting in reverse order of how things were laid out in the design section. The code will be broken out into different sections for easier digestion.
library(R6)
library(ggplot2)
library(uuid)
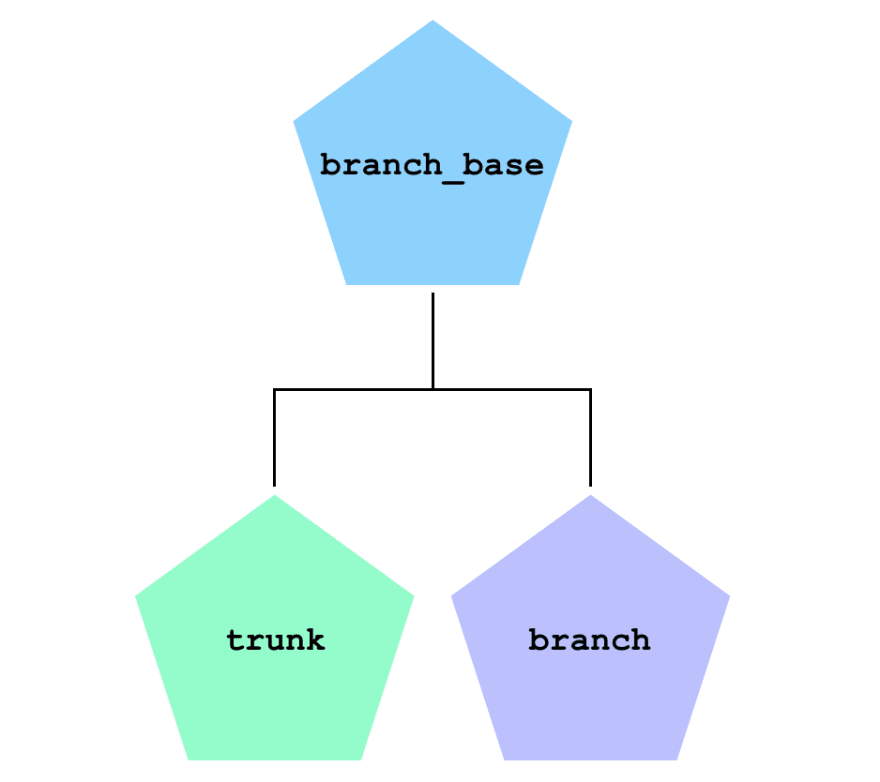
options(stringsAsFactors = FALSE)branch_baseThe branch_base class will be the shared parent of our trunk & branch classes. So we want to pack it full of bits that they’ll share. From an implementation standpoint, what they share is how they’re going to be plotted by ggplot2. Each attribute that is initialized in public is an attribute that will be used to our plot method. Additionally, we use the active feature that will build a data.frame on the fly to represent our branches. Functions that are placed in active can be accessed as if they’re static attributes.
branch_base = R6Class('branch_base',
                      public = list(
                          start_x = NA_integer_,
                          start_y = NA_integer_,
                          end_x = NA_integer_,
                          end_y = NA_integer_,
                          type = NA_character_,
                          id = NA_character_,
                          branch_color = NA_character_
                        ),  # public

                      active = list(
                        df = function() {
                            x = c(self$start_x, self$end_x)
                            y = c(self$start_y, self$end_y)

                            data.frame(x = x, y = y,
                                       type = self$type,
                                       id = self$id,
                                       branch_color = self$branch_color)
                          }
                        )  # active
) # branch_basetrunkThe trunk class inherits from branch_base, so we don’t have to think about initializing our attributes or redefining active. To define the class, we add an initialize method that will be used to create instances of trunk.
trunk = R6Class('trunk',
                inherit = branch_base,
                public = list(
                  initialize = function(len = 10, branch_color = '#000000') {
                      self$start_x = 0
                      self$start_y = 0
                      self$end_x = 0
                      self$end_y = len
                      self$type = 'trunk'
                      self$branch_color = branch_color

                      self$id = uuid::UUIDgenerate()
                    }
                  )  # public
) # trunkbranchThe definition of branch is similar to trunk, but a little more involved. When we need to create a branch, the info that we’ll be given is where it should start, what direction it should go in, and how long it should be. With these bits of information, we can use some trig to get the branch’s endpoint. The rest of the initialize method is very similar to trunk.
branch = R6Class('branch',
                 inherit = branch_base,
                 public = list(
                   initialize = function(x, y, len = 5, theta = 45,
                                         type = NA_character_, branch_color='#000000') {
                       dy = sin(theta) * len
                       dx = cos(theta) * len

                       self$start_x = x
                       self$start_y = y
                       self$end_x = x + dx
                       self$end_y = y + dy

                       self$type = type
                       self$id = uuid::UUIDgenerate()
                       self$branch_color = branch_color
                     }
                   )  # public
) # branchfractal_treeWith trunk and branch defined we have the building blocks for our fractal_tree class. This class definition is going to be broken up into sections due to its length/complexity.
publicThe public section of fractal_tree consists of the functionality we need to create and plot our tree. The initialize method creates all the branches of our tree including the trunk. The private$grow_branches method is a recursive private method of our class that we’ll define soon. The remaining public method is plot, which, unsurprisingly, will plot our tree. The contents of this method should look fairly familiar to those who are familiar with ggplot2. Thanks to our set up we can plot our tree with relatively little effort.
privateOur private section consists of a single method, grow_branches. This method will recursively build out our tree forever if given a starting point and an angle. To avoid infinite recursion we’ve built in the min_len attribute that will serve as a stopping point.
The body of the function consists of:
Creating 2 new branches that branch off to the left and right
Adding these branches to the branches attribute (the way this data.frame is dynamically grown could be re-written to be more efficient)
Repeating the process for the left branch (this recursively creates the entire left side of the tree)
Repeating the process for the right branch (this recursively creates the entire right side of the tree)
And that’s it! We now finally have all the pieces in place to create and plot a fractal_tree with R6 and ggplot2.
fractal_tree = R6Class('fractal_tree',
                       public = list(
                         delta_angle = NA_real_,
                         len_decay = NA_real_,
                         min_len = NA_real_,
                         branches = data.frame(),
                         branch_left_color = NA_character_,
                         branch_right_color = NA_character_,

                         initialize = function(trunk_len = 10,
                                               delta_angle = pi / 8,
                                               len_decay = 0.7,
                                               min_len = 0.25,
                                               trunk_color = '#000000',
                                               branch_left_color = '#000000',
                                               branch_right_color = '#adadad') {
                             self$delta_angle = delta_angle
                             self$len_decay = len_decay
                             self$min_len = min_len
                             self$branch_left_color = branch_left_color
                             self$branch_right_color = branch_right_color

                             self$branches = trunk$new(trunk_len, trunk_color)$df

                             private$grow_branches(0, trunk_len,
                                                   len = trunk_len * len_decay,
                                                   angle_in = pi / 2)
                           },  # initialize

                         plot = function() {
                             ggplot(tree$branches, aes(x, y, group = id,
                                    color=branch_color)) +
                               geom_line() +
                               geom_point(color = 'darkgreen', size=0.5) +
                               scale_color_identity() +
                               guides(color = FALSE, linetype = FALSE) +
                               theme_void()
                           }
                         ), # public

                       private = list(
                         grow_branches = function(start_x, start_y,
                                                  len = 1,
                                                  angle_in = pi / 2,
                                                  parent_type = NA,
                                                  parent_color = NA) {
      if (len >= self$min_len) {
          l_type = if (!is.na(parent_type)) parent_type else 'left'
          r_type = if (!is.na(parent_type)) parent_type else 'right'
          l_color = if (!is.na(parent_color))parent_color else self$branch_left_color
          r_color = if (!is.na(parent_color)) parent_color else self$branch_right_color

         branch_left  = branch$new(start_x, start_y, len, angle_in + self$delta_angle, l_type, l_color)
        branch_right = branch$new(start_x, start_y, len, angle_in - self$delta_angle, r_type, r_color)

        self$branches = rbind(self$branches, branch_left$df, branch_right$df)

        private$grow_branches(branch_left$end_x,
                              branch_left$end_y,
                              angle_in = angle_in + self$delta_angle,
                              len = len * self$len_decay,
                              parent_type = branch_left$type,
                              parent_color = branch_left$branch_color)

                              private$grow_branches(branch_right$end_x,
                                                    branch_right$end_y,
                                                    angle_in = angle_in - self$delta_angle,len = len * self$len_decay,
                 parent_type =  branch_right$type,
                 parent_color = branch_right$branch_color)
                             }
                           }  # grow_branches
                         )  # private
                       )  # fractal_tree

tree = fractal_tree$new()
tree$plot()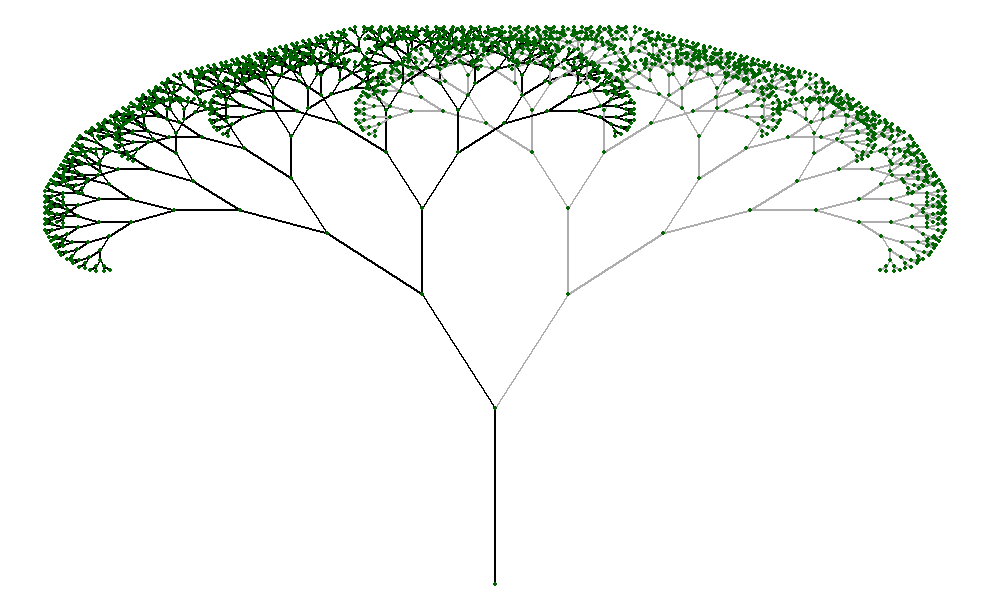
We already have a fractal_tree object that can create a single tree with branches positioned at a given angle. Now our goal is to create an animated fractal tree with R6 & gganimate. For simplicity, we will build our animated tree as a sequence of our (already defined) fractal_tree objects; each tree will be a frame in the animation.
We’ll create a single R6 class to house our animation process. The “Design” section above might seem to be written at a very high level, but it covers almost all of the implementation details that we’ll discuss below.
fractal_tree_seqThe object doing the animation is given the name fractal_tree_seq since it is simply a sequence of fractal_trees. In the initialize method of the object, we loop the user-provided angle_seq and create a tree at each angle in the sequence. Additionally, when we create each tree, we assign some metadata that shows which frame the tree belongs to. Lastly, in our initialize method we assign a color to each angle, this info will be used in plotting to give our animation some flare.
To wrap up our fractal_tree_seq class we add a public animate method that looks a lot like the plot method from the previous part. The syntax of gganimate is very similar to ggplot2’s, so experience with the latter should make the animate code feel familiar. The only bit of gganimate code we add to the ggplot2 expression is + transition_manual(frame). This command will use the frame data we assigned in initialize to create a gif of our fractal_trees. Here we are! We achieved the goal of creating and animating a fractal tree with R6 and gganimate.
# create line segment from (0, 0) to (0, len) to be trunk of fractal tree
create_trunk = function(len = 1) {
  end_point = c(0, len)
  trunk_df = data.frame(x=c(0, 0),
                        y=end_point,
                        id=uuid::UUIDgenerate())

  return(list(df=trunk_df, end_point=end_point))
}

# creates end point of line segment to satisfy length and
# angle inputs from given start coord
gen_end_point = function(xy, len = 5, theta = 45) {
  dy = sin(theta) * len
  dx = cos(theta) * len

  newx = xy[1] + dx
  newy = xy[2] + dy
  return(c(newx, newy))
}

# create a single branch of fractal tree
# returns branch endpoint coords and a plotly line shape to represent branch
branch = function(xy, angle_in, delta_angle, len) {
  end_point = gen_end_point(xy, len = len, theta = angle_in + delta_angle)
  branch_df = as.data.frame(rbind(xy, end_point))
  rownames(branch_df) = NULL
  names(branch_df) = c('x', 'y')
  branch_df$id = uuid::UUIDgenerate()

  return(list(df=branch_df, end_point=end_point))
}

# helper function to aggregate branch objects into single branch object
collect_branches = function(branch1, branch2) {
  return(list(df=rbind(branch1$df, branch2$df)))
}

# recursively create fractal tree branches
create_branches = function(xy,
                           angle_in = pi / 2,
                           delta_angle = pi / 8,
                           len = 1,
                           min_len = 0.01,
                           len_decay = 0.2) {
  if (len < min_len) {
    return(NULL)
  } else {
    branch_left = branch(xy, angle_in, delta_angle, len)
    subranches_left = create_branches(branch_left$end_point,
                                      angle_in = angle_in + delta_angle,
                                      delta_angle = delta_angle,
                                      len = len * len_decay,
                                      min_len = min_len,
                                      len_decay = len_decay)
    branches_left = collect_branches(branch_left, subranches_left)

    branch_right = branch(xy, angle_in, -delta_angle, len)
    subranches_right = create_branches(branch_right$end_point,
                                       angle_in = angle_in - delta_angle,
                                       delta_angle = delta_angle,
                                       len = len * len_decay,
                                       min_len = min_len,
                                       len_decay = len_decay)
    branches_right = collect_branches(branch_right, subranches_right)

    return(collect_branches(branches_left, branches_right))
  }
}

# create full fractal tree
create_fractal_tree_df = function(trunk_len=10,
                                  delta_angle = pi / 8,
                                  len_decay=0.7,
                                  min_len=0.25) {
  trunk = create_trunk(trunk_len)
  branches = create_branches(trunk$end_point,
                             delta_angle = delta_angle,
                             len = trunk_len * len_decay,
                             min_len = min_len,
                             len_decay = len_decay)

  tree = collect_branches(trunk, branches)$df

  return(tree)
}

# create a series of trees from a sequence of angles for branch splits
create_fractal_tree_seq = function(trunk_len=10,
                                   angle_seq=seq(0, pi, pi/16),
                                   len_decay=0.7,
                                   min_len=0.25) {

  tree_list = lapply(seq_along(angle_seq), function(i) {
    tree_i = create_fractal_tree_df(trunk_len,
                                    angle_seq[i],
                                    len_decay,
                                    min_len)
    tree_i$frame = i
    tree_i$angle = angle_seq[i]

    return(tree_i)
  })

  return(do.call(rbind, tree_list))
}

# create/animate a series of trees using gganimate
animate_fractal_tree = function(trunk_len=10,
                                angle_seq=seq(0, pi, pi/16),
                                len_decay=0.7,
                                min_len=0.25,
                                filename=NULL) {
  trees = create_fractal_tree_seq(trunk_len,
                                  angle_seq,
                                  len_decay,
                                  min_len)

  ggplot(trees, aes(x, y, group=id)) +
    geom_line() +
    geom_point(size=.2, aes(color=angle)) +
    scale_color_gradientn(colours = rainbow(5)) +
    guides(color=FALSE) +
    theme_void() +
    transition_manual(frame)
}

# example usage
animate_fractal_tree(trunk_len=10,
                     angle_seq=seq(0, 2 * pi - pi / 32, pi/32),
                     len_decay=0.7,
                     min_len=.25)
This code defines functions to create and animate fractal trees using the gganimate package. Let’s break down each function:
create_trunk: This function creates the trunk of a fractal tree. It takes the length of the trunk as input and returns a data frame representing the trunk’s line segment and its end point.
gen_end_point: This function calculates the end point of a line segment given its start point, length, and angle.
branch: This function creates a single branch of a fractal tree. It takes the start point, angle, angle change (delta_angle), and length of the branch as inputs. It returns a data frame representing the branch’s line segment and its end point.
collect_branches: This function aggregates two branch objects into a single branch object.
create_branches: This is a recursive function that creates fractal tree branches. It generates left and right branches recursively based on the given parameters such as the starting point, initial angle, angle change (delta_angle), length, minimum length (min_len), and length decay (len_decay).
create_fractal_tree_df: This function creates the full fractal tree as a data frame. It creates the trunk and then generates branches using create_branches, and aggregates them into a single data frame.
create_fractal_tree_seq: This function creates a series of fractal trees with different branch split angles. It takes a sequence of angles as input and generates fractal trees for each angle. It returns a data frame containing all the trees in the sequence.
animate_fractal_tree: This function creates an animation of the fractal tree sequence using gganimate. It calls create_fractal_tree_seq to generate the trees and plots them using ggplot. Each frame of the animation represents a different angle of branch split. The animation transitions between frames based on the frame variable.
Example Usage: This part demonstrates how to use the animate_fractal_tree function with some example parameters.
Moreover, these functions provide a comprehensive toolkit for generating and animating fractal trees, allowing for experimentation with different parameters such as trunk length, branch split angles, length decay, and minimum length. The resulting animation provides visual insights into how fractal trees evolve with varying parameters.
Note: If you end up running this code, you’ll see that this approach might not be the most efficient, but it works.